Darvas box theory is a trading strategy developed by Nicolas Darvas to target stocks using highs and volume as key indicators. Darvas developed his theory in the 1950s while travelling the world as a professional ballroom dancer. Darvas' trading technique involves buying into stocks that are trading at new highs and drawing a box around the recent highs and lows to establish entry point and placement of the stop-loss order. A stock is considered to be in a Darvas box when the price action rises above the previous high but falls back to a price not far from that high.
KEY TAKEAWAYS
- Traders applying the Darvas box theory target stocks with increasing trade volume.
- The Darvas box theory isn't locked into a specific time period, so the boxes are created by drawing a line along the recent highs and recent lows of the time period the trader is using.
- The Darvas box theory works best in a rising market and/or by targeting bullish sectors.
What Does Darvas Box Theory Tell You?
The Darvas box theory is type of momentum strategy. The Darvas box theory uses market momentum theory along with technical analysis to determine when to enter and exit the market. Darvas boxes are a fairly simple indicator created by drawing a line along lows and highs to make the box. As you update the highs and lows over time, you will see rising boxes or falling boxes. Darvas box theory suggests only trading rising boxes and using the highs of the boxes that are breached to update the stop-loss orders.
Despite being a largely technical strategy, Darvas box theory as originally conceived did mix in some fundamental analysis to determine what stocks to target. Darvas believed his method worked best when applied to industries with the greatest potential to excite investors and consumers with revolutionary products. He also preferred companies that had shown strong earnings over time, particularly if the market overall was choppy.
The Darvas Box Theory in Practice
The Darvas box theory encourages traders to focus on growth industries, meaning industries that investors expect to outperform the overall market. When developing the system, Darvas selected a few stocks from these industries and monitored their prices and trading every day. While monitoring these stocks, Darvas used volume as the main indication as to whether a stock was ready to make a strong move.
Once Darvas noticed an unusual volume, he created a Darvas box with a narrow price range based off the recent highs and lows of the trading sessions. Inside the box, the stock’s low for the given time period represents the floor and the highs create the ceiling. When the stock broke through the ceiling of the current box, Darvas would buy the stock and use the ceiling of the breached box as the stop-loss for the position. As more boxes were breached, Darvas would add to the trade and move the stop-loss order up. The trade would generally end when the stop-loss order was triggered.
The Origin of Darvas Box Theory
While traveling as a dancer in the 1950s, Darvas obtained copies of The Wall Street Journal and Barron's, but only used the listed stock prices to determine his investments. By drawing boxes and following strict trading rules, Darvas turned a $10,000 investment into $2 million over an 18-month period. His success led him to write "How I Made $2,000,000 in the Stock Market" in 1960, popularizing the Darvas box theory.
Today, there are variations to the Darvas box theory that focus on different time periods to establish the boxes or simply integrate other technical tools that follow similar principles like support and resistance bands. Darvas' initial strategy was created at a time when information flow was much slower and there was no such thing as real time charting. Despite that, the theory is such that trades can be identified and entry and exit points set applying the boxes to the chart even now.
Limitations of the Darvas Box Theory
Critics of the Darvas box theory technique attribute Darvas’ initial success to the fact that he traded in a very bullish market, and assert that his results cannot be attained if using this technique in a bear market. It is fair to say that following the Darvas box theory will produce small losses overall when the trend doesn't develop as planned. The use of a trailing stop-loss order and following the trend/momentum as it develops has become a staple of many technical strategies developed since Darvas. As with many trading theories, the true value in the Darvas box theory may actually be the discipline it develops in traders when it comes to controlling risk and following a plan. Darvas emphasized the importance of logging trades in his book and later dissecting what went right and wrong.
The Darvas Box: A Timeless Classic
In the late 1950s, Nicolas Darvas was one half of the highest paid dance team in show business. He was in the middle of a world tour, dancing before sold-out crowds. At the very same time, he was on his way to becoming a now forgotten Wall Street legend, buying and selling stocks in his spare time using only Barron's weekly newspaper for research and sending telegrams to communicate with his broker. However, Darvas turned a $36,000 investment into more than $2.25 million in a three-year period. Many traders argue that Darvas' methods still work, and modern investors should study his 1960 book, "How I Made $2 Million in the Stock Market." Read on as we cover the Darvas Box trading method.
Darvas Who?
The path Nicolas Darvas took to stock market riches was unusual. He fled his native Hungary ahead of the Nazis. Eventually, he reunited with his sister and they began dancing professionally in Europe after WWII. When he wasn't performing, he spent countless hours studying the stock market. He gained an understanding of the fact that stocks are risky and taking profits is the key to riches. (See also: Stocks Basics.)
Darvas began his trading career in the speculative Canadian stock markets and his first purchase led to a profit of more than 200%. His initial success was short-lived, and the rough and tumble Canadian markets soon took back his profits, and then some. Several years later, he turned to the New York Stock Exchange and brought a trading mentality to the market.
Trading Philosophy
Trading was not easy at that time. Stock investing in the 1950s required a full-service broker. Buying high-quality, dividend-paying stocks was the most common investment philosophy. Commissions were high, and investors favored dividend income over capital gains. Darvas brought his unique techno-fundamental theory of investing to this market, with no consideration of dividends and clearly defined stop-loss points.
To identify trading candidates, Darvas applied a distinctive fundamental filter. He looked for industries he expected to do well over the next 20 years. In the 1950s, electronics, missiles and rocket technology fascinated the American public. Companies in these industries would benefit from revolutionary new products that would lead to exponential earnings growth. (See also: Introduction to Fundamental Analysis.)
In thinking this way, Darvas had learned from his study of stock market history that he could profit greatly if he could anticipate the next big thing. He notes in his book that in the late 1800s, railroad companies ruled Wall Street; a generation later it was automobile companies that represented an emerging technology. Investors were always on the hunt for the something new and exciting. To find stocks with the greatest potential, his research indicated that you needed to find the industries with the greatest potential.
The Strategy
From a developed industry list, Darvas would create a watch list of several stocks from each industry. Because of the commission structure of the day, he focused on higher-priced stocks. With fixed commissions, the cost of trading, on a per-share basis, declined rapidly as the price of the stock increased. While this was of no concern to the buy-and-hold investor, Darvas realized that a significant part of his trading profits would be lost to commissions if he was not careful. Modern day investors can look at stock price as a filter indicating that the company has some stability—very low-priced stocks often stay low for fundamental reasons in today's markets.
Armed with his list of trading candidates, Darvas watched for a sign that the stock was ready to move. The only indicator he used was volume, watching for heavy volume among his short list of trading candidates. When he spotted unusual volume, he would contact his broker and request daily quotes.
He was looking for stocks trading within a narrow price range, which he defined using a set of precise rules. The upper limit was the highest price a stock reached in the current advance that was not penetrated for at least three consecutive days. The lower limit was a new three-day low that held for at least three consecutive days.
After spotting the range, he would cable his broker with a buy order just above the top of the trading range and a stop-loss order just below the bottom of the range. Once in a position, he trailed his stop based on the action in the stock. In his experience, boxes often "piled up," which meant that they formed new box patterns as a stock climbed higher. Each time a new box formation was completed, Darvas raised his stop to a fraction below the new bottom of the new trading range.
Turning a Profit in Lorillard
In trading, a picture is worth a thousand words, and we can look at an example from Darvas' book to gain a clearer understanding of his method. In late 1957, Darvas was performing in Saigon, Vietnam (present-day Ho Chi Minh City), and noticed a volume spike in Lorillard Tobacco Co. (since absorbed into British American Tobacco plc). He began following the stock closely by asking his broker to begin providing daily quotes.
Source: "How I Made $2 Million In The Stock Market" (1960) by Nicolas Darvas
A. He identified Lorillard's industry and learned that it was selling a lot of Kent and Old Gold cigarettes. While not a technology stock, cigarettes were a growth industry at this time, before the U.S. Surgeon General warning appeared on every pack. (See also: The Stages of Industry Growth.)
B. He bought 200 shares of Lorillard at 27½, as it broke above the box.
C. Unfortunately, his stop at 26 was hit a few days later when the stock price went back into the box.
D. Seeing continued strength reaffirmed his conviction that the stock was going higher, and Darvas repurchased 200 shares at 28¾.
E. Confident in his selection, Darvas bought another 400 shares at 35 and 36½.
F. Continued strength after the drop in February 1958 led to another purchase of 400 shares at 38.
G. To raise money to purchase another stock, Darvas closed his entire position at 57, for a profit of more than 60% in about six months. By comparison, the Dow Jones Industrial Average gained about 7.5% over that same time frame. (See also: Is Your Portfolio Beating Its Benchmark?)
The simple Darvas method used to profit from Lorillard can also work in the current markets. But now the internet has replaced the telegraph, and it also provides real-time quotes, eliminating the need to wait for Barron's to be delivered on Saturday morning. Spotting high volume breakouts is relatively simple to do, and profits like Darvas made are possible if traders apply his disciplined approach.
The Bottom Line
Much of Nicholas Darvas' success stems from his confidence in his trading strategy. He became proficient at managing risk and taking his profit off the table before the position had the chance to reverse.
Nicolas Darvas Made $2,000,000 using Trend Following Methods

Unknown to most trend following has endured for centuries. And sometimes investors not typically remembered as trend following traders–were exactly that.
Pas de Dough with Nicolas Darvas
Nicolas Darvas (1920–1977) was a dancer, self-taught investor and author. He is best known for his book, “How I Made $2,000,000 in the Stock Market.”
Trend following trader? You bet.
From Time Magazine Monday, May. 25, 1959:
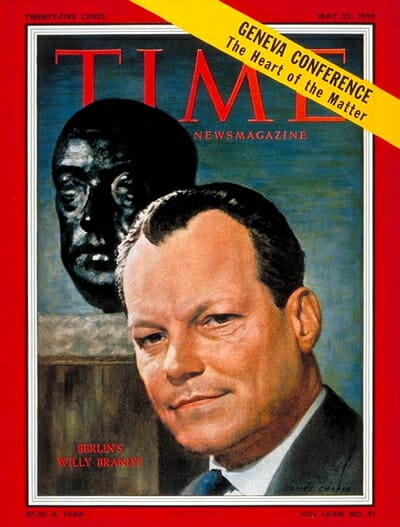
Monevman Darvas’ methods would raise the eyebrows of most Wall Streeters. Instead of studying what Wall Street calls the fundamentals—price-earning ratios and dividends—he judges public enthusiasm, a method that works best in volatile markets. “In my dancing I know how to judge an audience,” he says. “It is instinctive. The same way with the stock market. You have to find out what the public wants and go along with it. You can’t fight the tape, or the public.”
More:
Darvas’ system is tailored to his job. Since he has to do trading from wherever he is dancing (he recently completed an Asian tour) he ignores tips, financial stories and brokers’ letters, has never been in a broker’s office. Basically, his approach is that of a chartist: he watches price and volume.
More:
Suddenly, on 35,000 shares [random company] moved from 16 to 50. He bought in at 51, though he knew nothing about the company, and “I didn’t care what they made.” (They make hardwood flooring.) He sold out at 171 six weeks later.
More:
“I have no ego in the stock market,” he says. “If I make a mistake I admit it immediately and get out fast.” Darvas thinks his system is the height of conservatism. Says he: “If you could play roulette with the assurance that whenever you bet $100 you could get out for $98 if you lost your bet, wouldn’t you call that good odds?” If he has a big profit in a stock, he puts the stop-loss order just below the level at which a sliding stock should meet support. He bought Universal Controls at 18, sold it at 83 on the way down after it had hit 102. “I never bought a stock at the low or sold one at the high in my life,” says Darvas. “I am satisfied to be along for most of the ride.”

Question: Have the markets changed?
Darvas: “Have the markets changed” In short No.
Darvas: “Have the markets changed” In short No.
You see the markets are simply human emotion reflected in $$’s. People really need to get this into their heads. It’s not about logic. Company results. Mathematics but emotion. When emotion and logic collide. Emotion will always come out ahead.
The way I traded in the 1950’s and made such fantastic money was simply the same method Livermore and Barauech traded before me. I traded the same way right the way through the 1960’s and 1970’s. And I am certain it will be the same going into the year 2000. It’s all about riding huge waves of emotion to the maximum.
The big money is made from these moves. It’s crazy. But we are only human…Well you see, to me my method had to make sense. I had to be able to explain it to my partner (who knows absolutely noting about stocks) and she had to grasp the reason why it worked. In short it had to have a lot of common sense about it.
My Darvas method was simply looking for the most in demand stocks, in the best sectors in a market Not GOING down. I would ride them as far as the ride would let me and exit when it was over…Makes sense right?
But if you ask many traders to explain their method and straight away they mention Elliot Waves, Fib. Retracements, Cycles etc…my question is always So WHY should a stock go up because of this? I am always left with a blank expression.
They simply had no valid reason to trade these stocks. It had no common sense reason to go up. And I found most complicated technical analysis is like this. Great on theory short in common sense. Traders are much better spending their time on managing them-selves and managing their money than trying to find a new “secret” to the markets.
Note: The two books which Nicolas Darvas read almost every week were The Battle for Investment Survival (PDF), by Gerald M. Loeb, published in 1935, and Tape Reading and Market Tactics (PDF), by Humphrey Bancroft Neill, published in 1931. The Battle for Investment Survival also in EPUB format.
How I Made $2,000,000 in the Stock Market
The classic trend following How I Made $2,000,000 in the Stock Market by Nicolas Darvas:
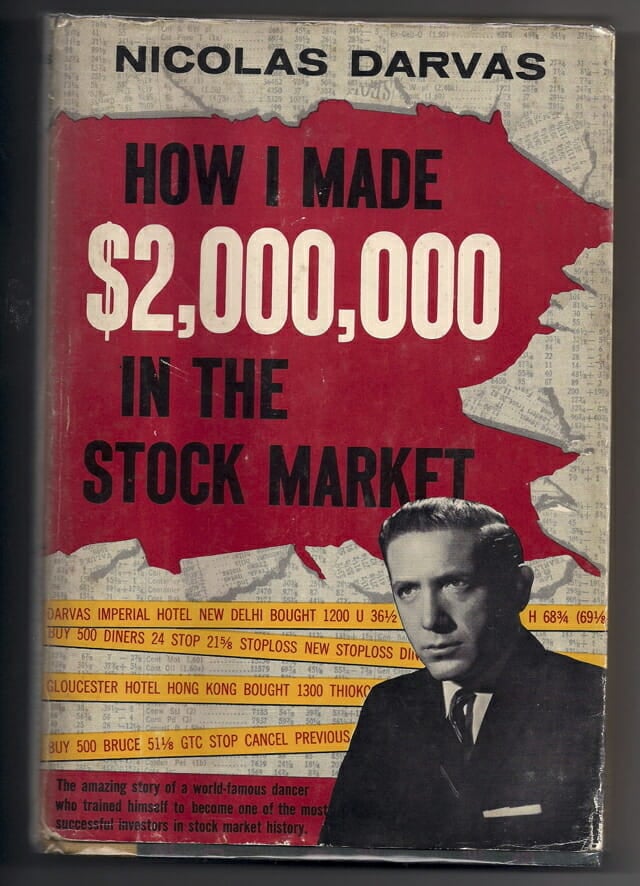
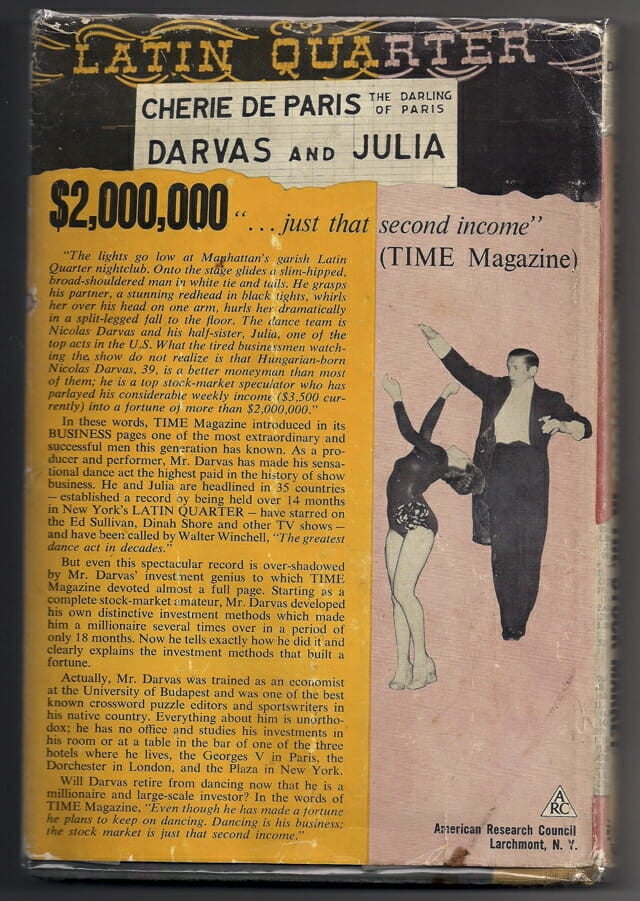
His other book Wall Street: The Other Las Vegas (front cover and back cover).
Profit in Lorillard
In late 1957, Darvas was performing in Saigon and noticed a volume spike in Lorillard. He began following the stock closely by asking his broker to begin providing daily quotes.
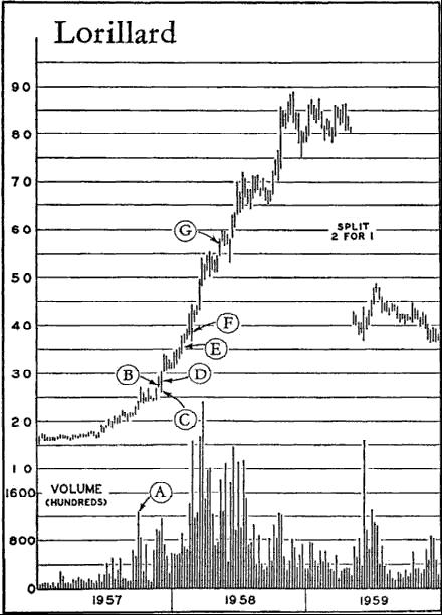
A. He identified Lorillard’s industry and learned that it was selling a lot of Kent and Old Gold cigarettes. While not a technology stock, cigarettes were a growth industry at this time, before the Surgeon General warning appeared on every pack. (For related reading, see The Stages Of Industry Growth.)
B. He bought 200 shares of Lorillard at 27½, as it broke above the box.
C. Unfortunately, his stop at 26 was hit a few days later when the stock price went back into the box.
D. Seeing continued strength reaffirmed his conviction that the stock was going higher, and Darvas repurchased 200 shares at 28¾.
E. Confident in his selection, Darvas bought another 400 shares at 35 and 36½.
F. Continued strength after the drop in February 1958 led to another purchase of 400 shares at 38.
G. To raise money to purchase another stock, Darvas closed his entire position at 57, for a profit of more than 60% in about six months. By comparison, the Dow Jones Industrial Average gained about 7.5% over that same time frame. (For more on evaluating returns, see Is Your Portfolio Beating Its Benchmark?); Source: “How I Made $2 Million In The Stock Market” (1960) by Nicolas Darvas
Investopedia notes: The simple Darvas used to profit from Lorillard can also work in the current markets. The internet has replaced the telegraph, and also provides real-time quotes, eliminating the need to wait for Barron’s to be delivered. Truth.
Timeless. Enduring. Human nature never changes. Profit from it.
Every so often we like to re-read classic investing books. One of my personal favorites is “How I Made Two Million Dollars in The Stock Market” by Nicolas Darvas. This is an excellent story about how the market really works. It illustrates how Darvas evolved as a trader.
Nicolas Darvas began like most of us with no idea on how the market functions. After several failures, he went through a severe period of introspection and began “learning” how the market worked.
Lesson 1: Focus On Strong Fundamentals
His first major realization was that he had to narrow down the list of stocks he was involved with. He did this by focusing on the company’s fundamentals and the stock’s technicals. He quickly realized that companies that exhibited strong fundamentals (impressive earnings and sales growth) enjoyed solid stock price appreciation. However, he soon realized that this was only one-half of the equation.
Lesson 2: Strong Technicals Matter
One of the things Nicolas Darvas is most famous for is the “Darvas Box”. The Darvas Box is essentially consolidations after a stock breaks out and runs up.
Darvas realized the importance of buying strength and began understanding how stocks move (i.e. rally, consolidate, rally, top out, and then fall). Each consolidation became known as “boxes.” Darvas developed/refined his rules through post analysis while he was performing overseas (he was a ballroom dancer). The only access he had to Wall Street were overnight cables from his broker(s) and a weekly edition of Barron’s. His daily cables helped him keep track of his individual holdings and his weekly edition of Barron’s helped him isolate stocks that exhibited strong price and volume action.
Lesson 3: Follow Rules
Even after his two-year dancing contract had expired, Darvas decided to continue this distant relationship with Wall Street. This kept him separated from the “crowd” and the various rumors which constantly plague the Street. By simply following the stocks price and volume action, Darvas was able to create a trading methodology which has shaped the thinking for investors to present day.
Lesson 4: Be Flexible
Some of our closest friends and readers are “pure” fundamentalists. We can talk for endless hours (perhaps weeks) with little avail to convince them otherwise. We also have readers that invest strictly on the underlying technicals and the same is true for them.
